
AI Call Option Bubble: How S&P 500/ Nasdaq Got Thunderstruck
Tesla, Nvidia, and Palantir are being swept up in call option mania — a speculative thunderstorm that’s driving markets to record highs.

Stocks hit record valuations fueled by Tesla, Nvidia, and Palantir. Discover how AI call option mania and hype are driving markets higher, and how Wall Street pros are positioning for the risks ahead. Got Vix?. This in-depth financial white paper report breaks down the data and strategies behind the surge.
Struck by Lightning
Imagine Deadpool as the legacy financial media. He’s grinning, cracking jokes, and telling everyone to trust him — that nothing can go wrong, that prices can never go down. In Deadpool 2, he convinces a ragtag crew to jump out of an airplane into hurricane-force winds. The warnings are flashing red, but the team listens anyway. Why? Because Thunderstruck is blasting in the background. The drumbeats are pounding, the guitar riff is electric, and the adrenaline makes everyone feel invincible. They strap on their parachutes and leap with reckless confidence, convinced gravity won’t touch them.
That’s exactly what Wall Street feels like today. Tesla, Nvidia, and Palantir aren’t just climbing — they’re being thunderstruck. Momentum is euphoric, fundamentals are ignored, and traders are rushing in because the music is loud and media like CNBC and Bloomberg are cheering. But as with Deadpool’s ill-fated jump team, reality is waiting. The winds are real. Gravity never disappears. Most speculators will crash spectacularly, while only a few insiders — the ones who understood the conditions and prepared their landing — will walk away unscathed.
This isn’t just a rally. It’s a spectacle. And the force behind it isn’t earnings growth or institutional accumulation. It’s call option mania — a speculative inferno powered by hedge fund traders with leveraged ETFs, and the hedging reflexes of dealers that have turned the market into a machine running on momentum alone. The music is loud, the adrenaline is real, but when it stops, the question will be who’s still standing.
To understand the storm, we need to break it down in stages: first valuations, then money flow, and finally the mechanics of options that have amplified every spark into lightning bolts across the market.
Valuations at Rarefied Heights
The first warning sign comes from valuations. By Robert Shiller’s cyclically adjusted price-to-earnings ratio (CAPE), the U.S. stock market now stands at 40.
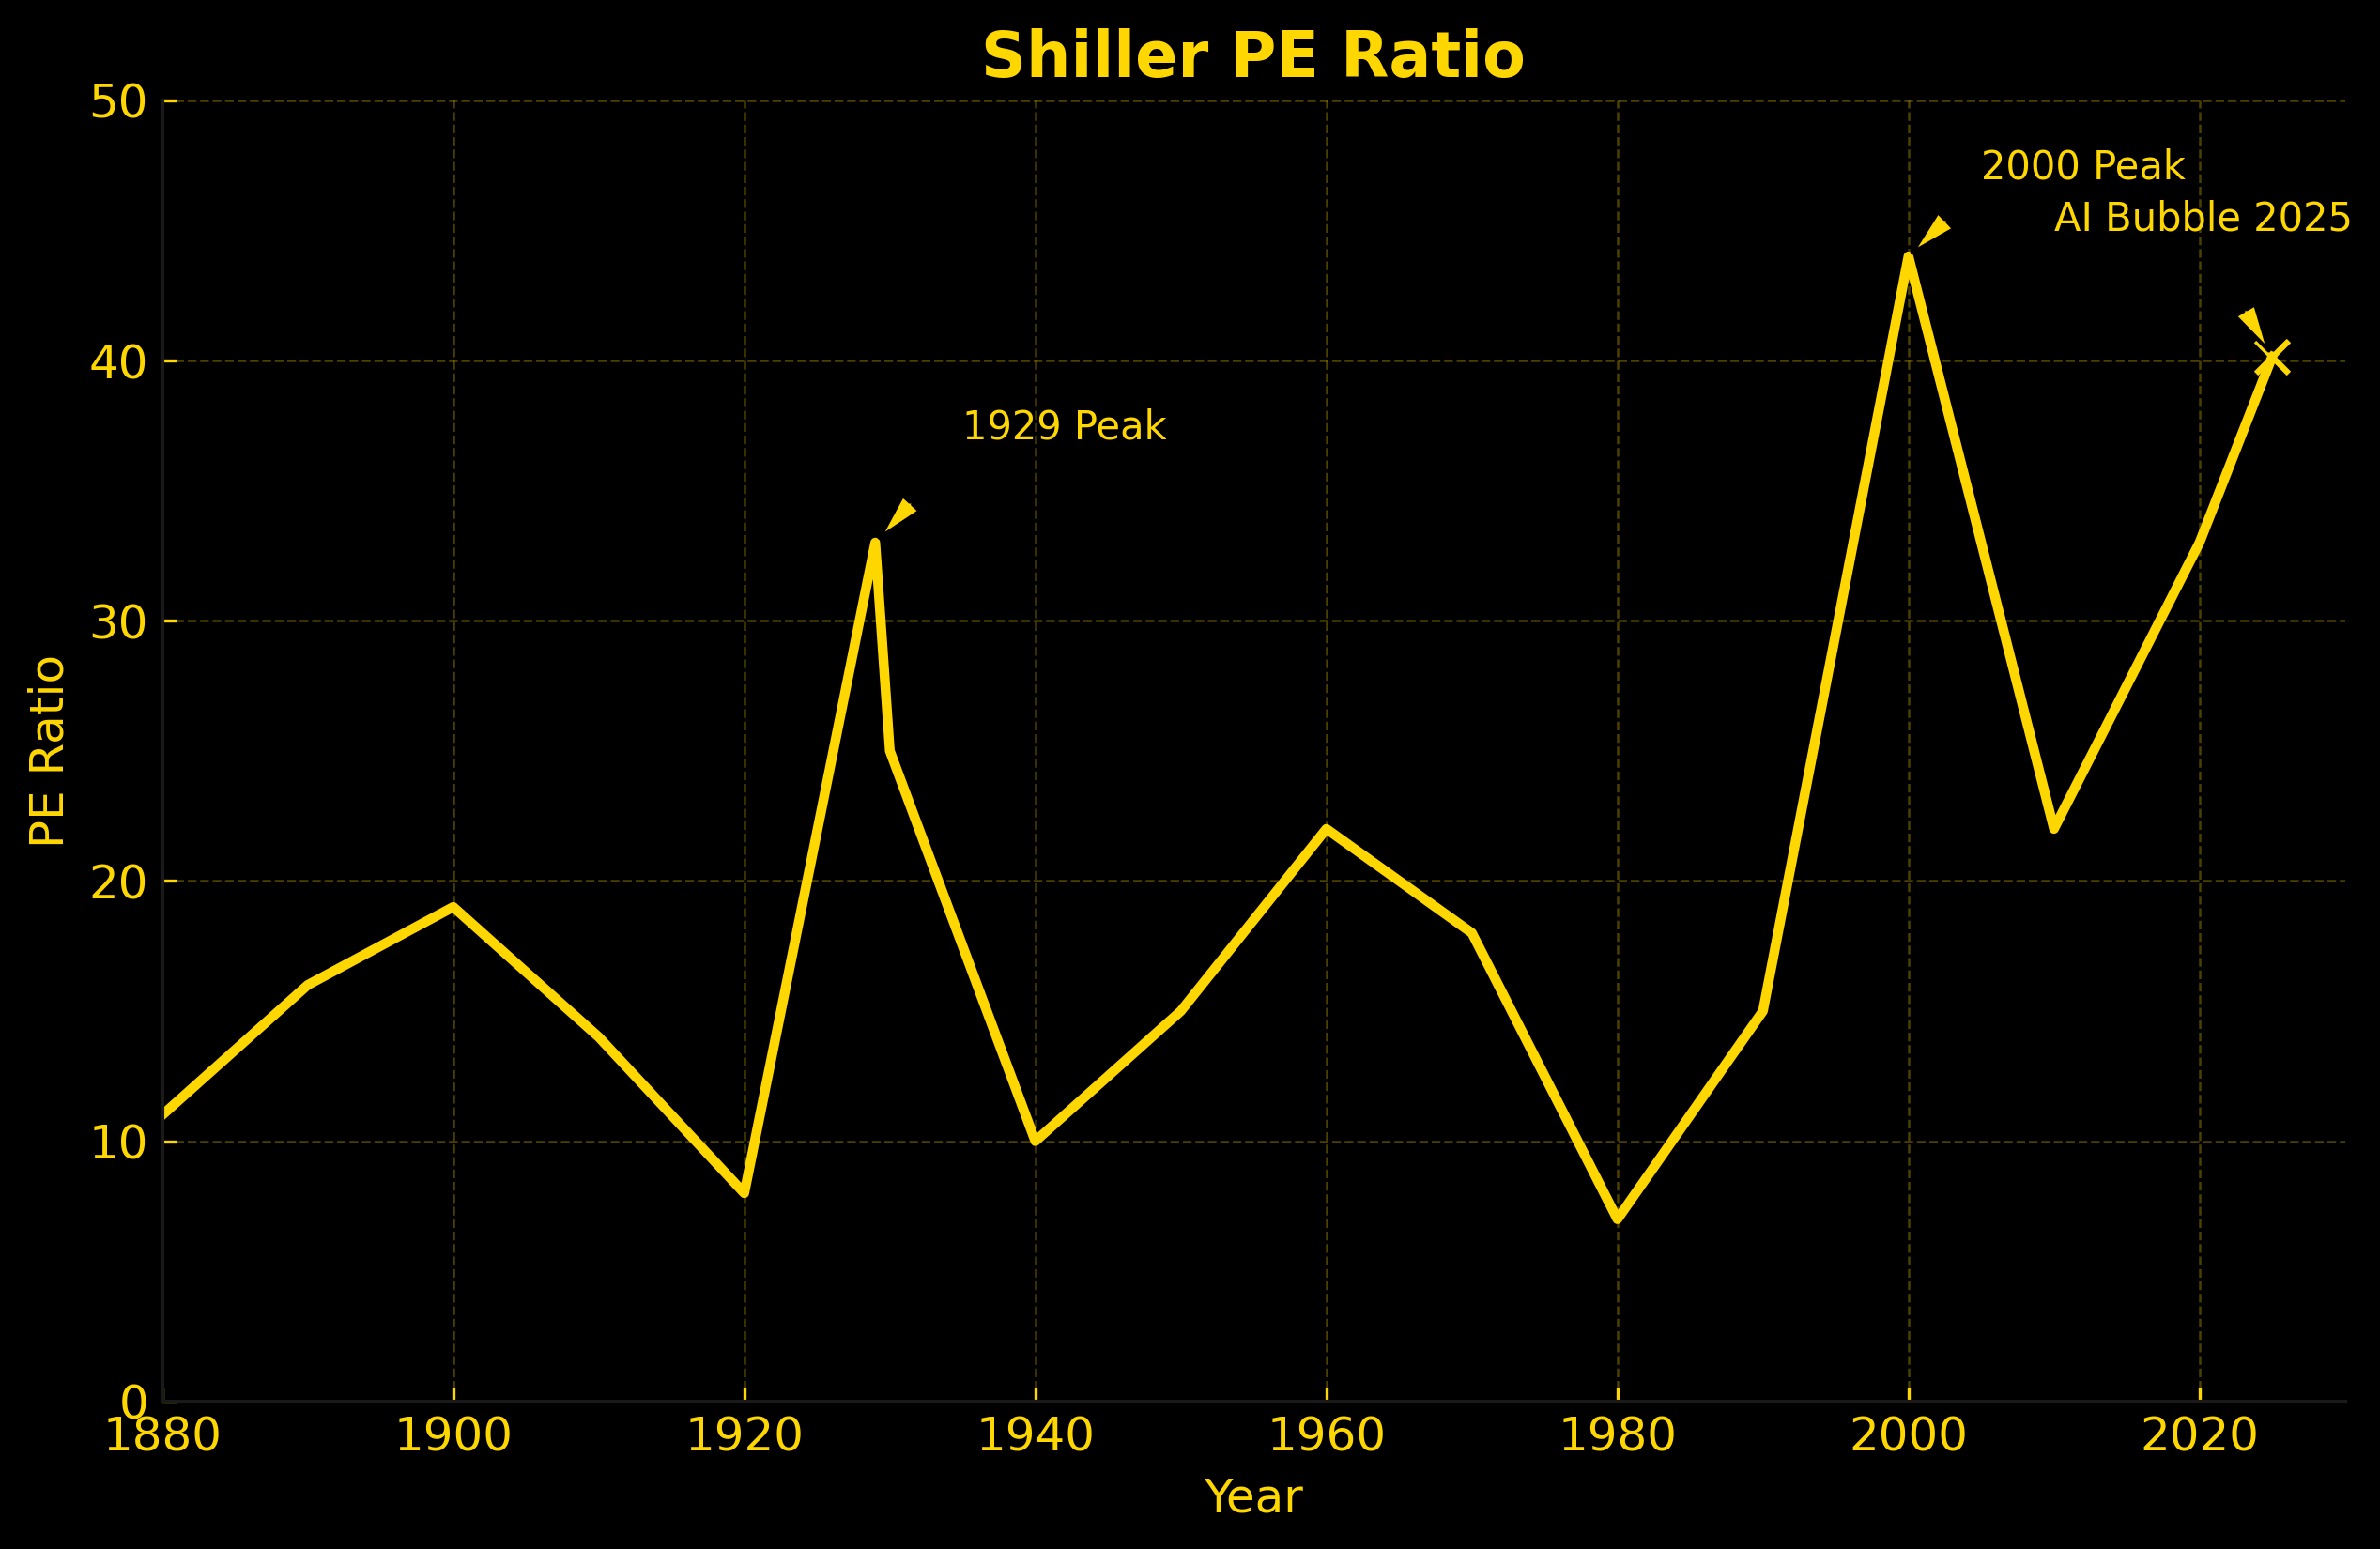
This level has been reached only once before: the dot-com bubble in 2000. In 1929, CAPE topped at 33 before the Great Depression. In 2021, amid meme stocks and stimulus checks, it hit 38 before unwinding. Crossing 40 again tells us the market is priced as if nothing can go wrong.
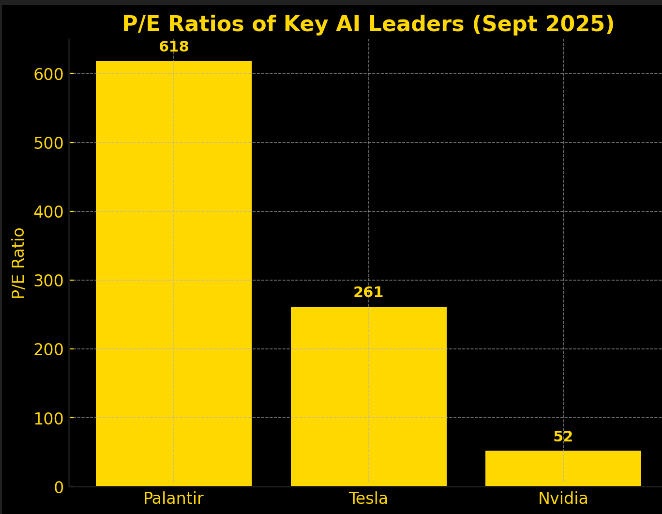
On the single-stock basis, the situation remains highly stretched. Tesla’s P/E has increased to 261, a significant rise from 190 earlier this year. This surge occurs despite the company’s earnings misses & substantial sales and revenue declines. Notably, the most profitable feature for Tesla, the EV Tax credit, will cease to be available on October 1, 2025 (meaning where will Tesla future profits come from?). Nvidia’s multiple has climbed from 45 to 52, even as revenue growth shows signs of cooling. Palantir trades at an astronomical 618, compared to 550 earlier this year, despite being an unproven business at scale valued over $400 billion on a total annual revenue around $4 billion.
In Deadpool terms, this is the moment the media is shouting over the roar of the engines, promising the jump is safe. Everyone is grinning, strapping in, ignoring the fact that the winds outside are lethal.
Money Flow: The CMF Warning
Valuations tell us prices are stretched, but Chaikin Money Flow (CMF) tells us who’s actually buying. CMF combines price and volume to measure whether institutions are accumulating or distributing stock.
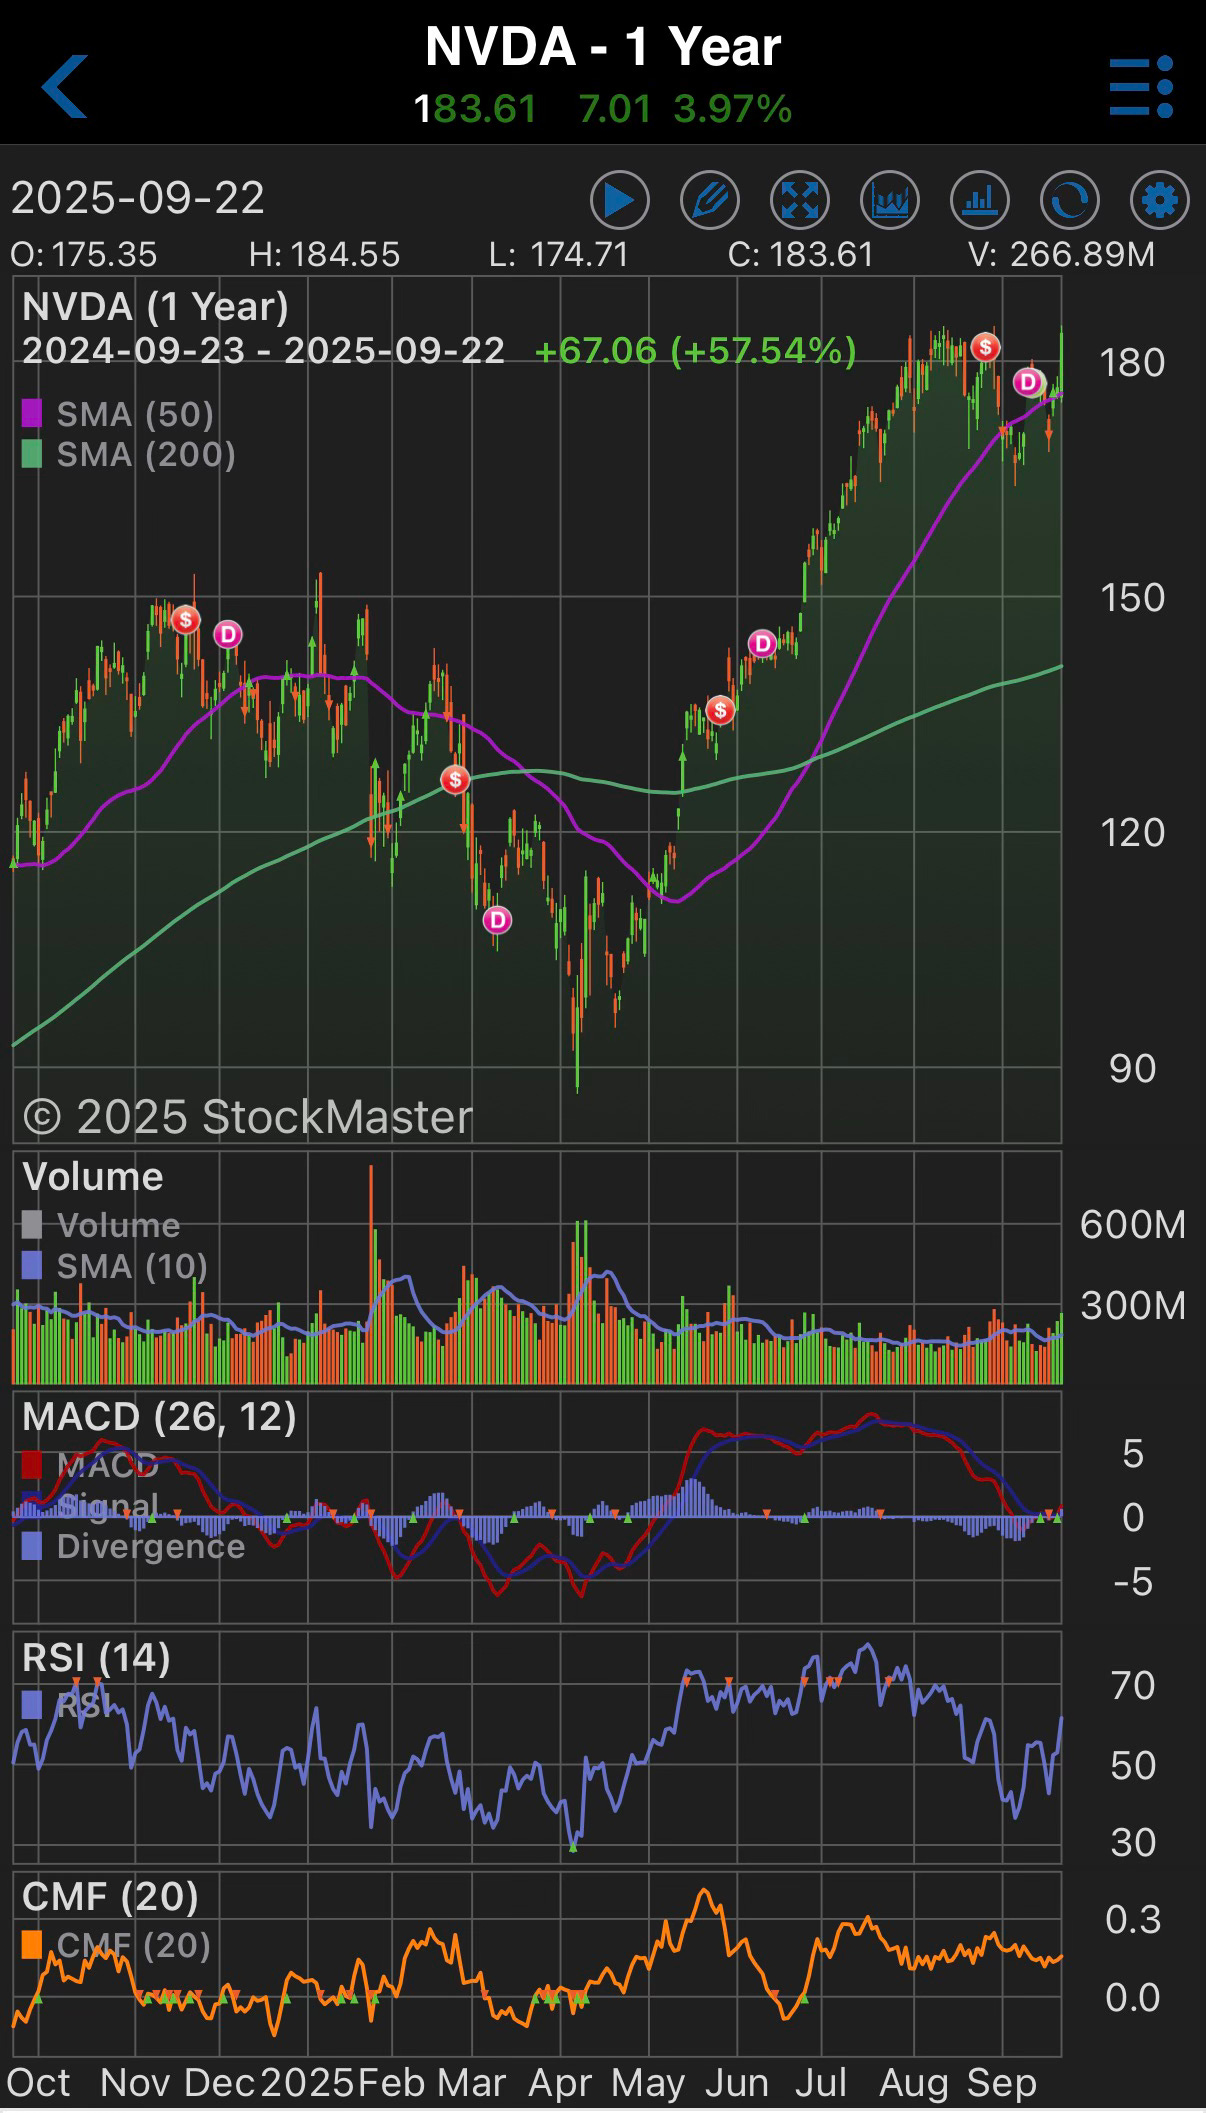
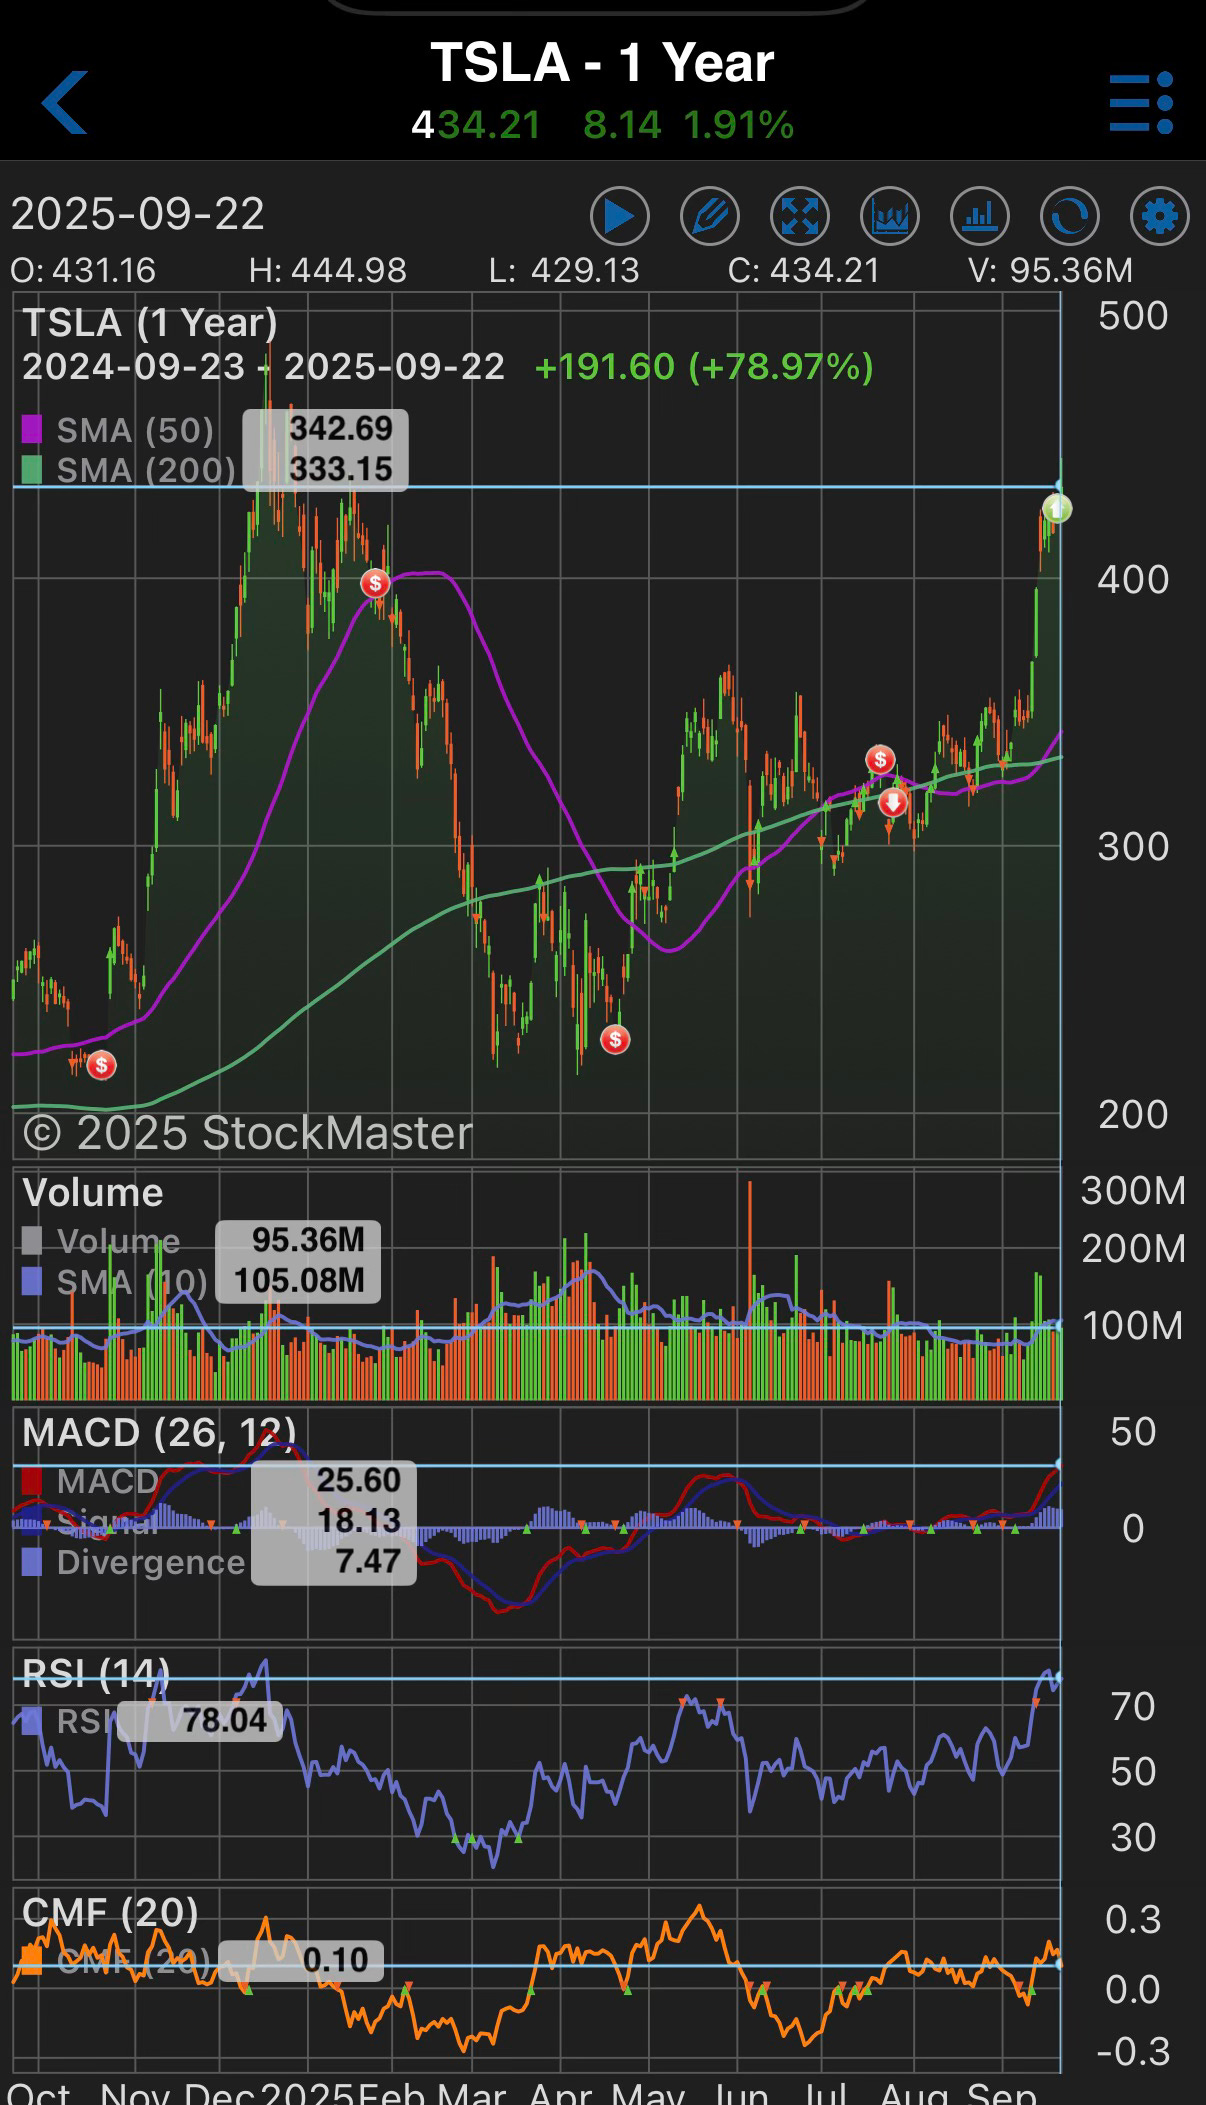
Take Nvidia. On September 22, it closed at $183.61, up nearly 58% over the past year, on 266.9 million shares traded. Tesla ended at $434.21, up almost 79%, on 95.3 million shares traded. SPY, the S&P 500 ETF, closed at $666.84, up 17%. These numbers scream “bull market.”
But CMF (orange line on the graph) for Nvidia is at 0.16. A warning sign when you are at a record high.
and Tesla is flat to modest coming in at 0.10 near its record high.
Meaning Institutions are NOT buying. The rallies are being pushed mechanically, not by deep-pocketed conviction.
In our airplane metaphor, CMF is the parachute inspection. Retail traders are leaping without checking their gear. Institutions are checking — and many aren’t even jumping.
For the Full Access Team:
Do you want to understand how gamma squeezes distort prices and fuel runaway rallies?
Do you want to see how 2x & 3x leveraged ETFs can turn speculation into outright mania?
Would it help to know what today’s extreme options volumes reveal about cracks forming under the surface?
Do you want to see how Wall Street are protecting themselves while retail traders keep taking risks?

Keep reading with a 7-day free trial
Subscribe to The Coastal Journal to keep reading this post and get 7 days of free access to the full post archives.