


Stock Market Bulls Celebrate Record High
Bulls Got the Move, Bears Nailed the Data, How & Why?

As 2025 began, the stock market was flashing signs of a bubble (as written about here) The NASDAQ hovered near record valuations despite stagnant earnings growth and critical economic indicators signaling trouble ahead. With the price-to-earnings ratio hitting a stretched 30, markets appeared dangerously disconnected from economic reality. Margin compression, declining consumer demand, and negative real GDP growth in Q1 (-0.5%) were all hidden beneath a rising market, waiting for a trigger.
Then came the tariffs.
In February, President Trump introduced aggressive tariffs on all imports—initially set at insane rates in March before scaling back in April. These protectionist measures shook global supply chains and rattled investor confidence. Markets reacted swiftly and sharply, sending the NASDAQ down nearly -25%.
The Economic Bears Have Been Right on Data
Fast forward to today, June 26, 2025, and the market has astonishingly bounced back to new highs as the President reverse course on large scale tariffs in April. But, earnings remain stagnant, forward guidance is weak, and both consumer and industrial sectors continue to deteriorate. High-profile companies like FedEx just issued a warning this week, explicitly blaming tariff-driven disruptions for declining business prospects. Despite a -5% plunge in FedEx stock following earnings, broader markets are ignoring these warning signs.
The bears argued that tariffs would harm both the U.S. and global economies, and recent data confirms their thesis. The latest trade deficit report shows U.S. exports falling more than -5%, undermining Trump's stated goal of boosting American exports. Lower exports directly translate into declining revenues and profitability for American businesses.
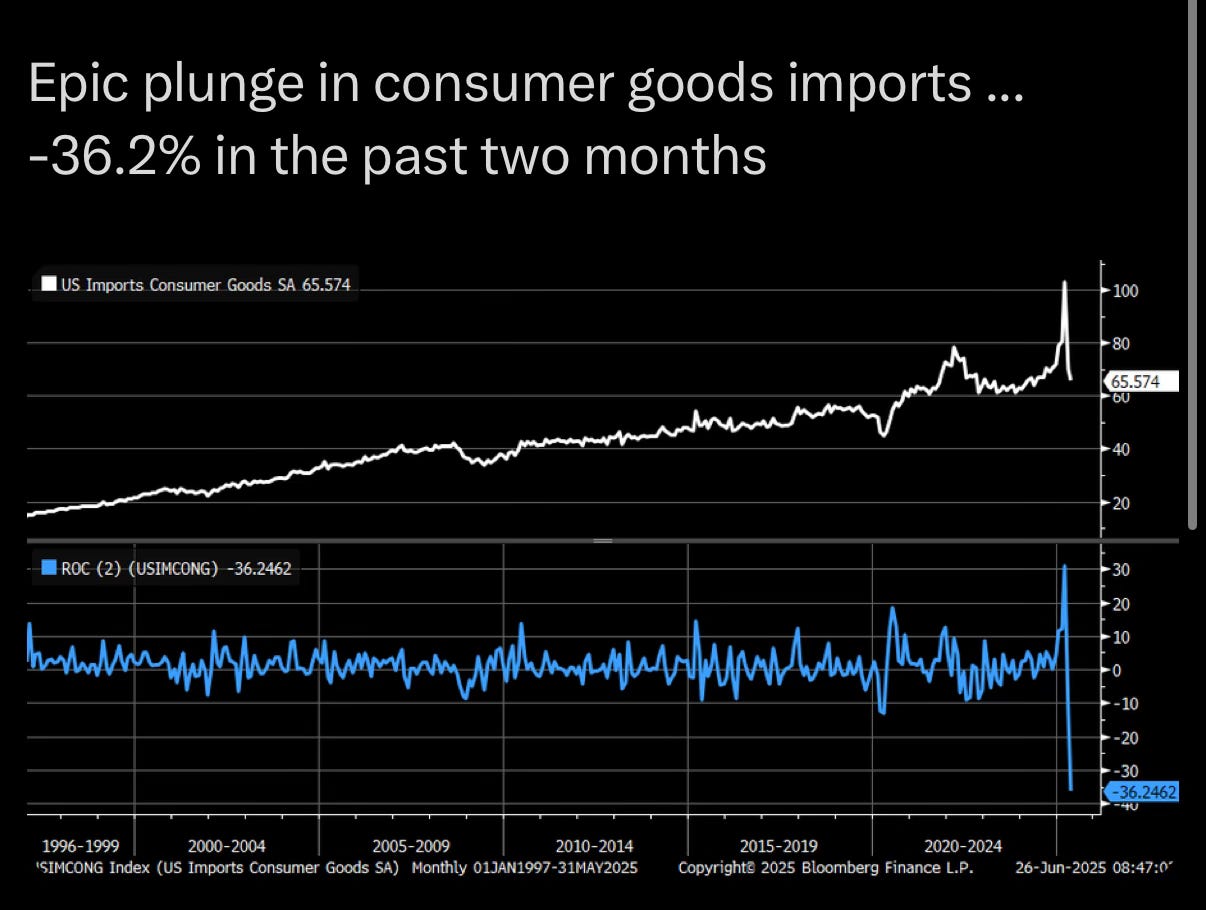
Imports have also plunged dramatically—down -36% since tariffs began. Companies are importing significantly fewer goods, resulting in less revenue, reduced profits, and fewer business deals overall. (which was written about would happen here )
Housing market data further underscores economic deterioration. With mortgage rates around 7%, the real estate sector is effectively frozen. New home sales dropped sharply, down nearly -14% in May, pushing housing supply to a three-year high.
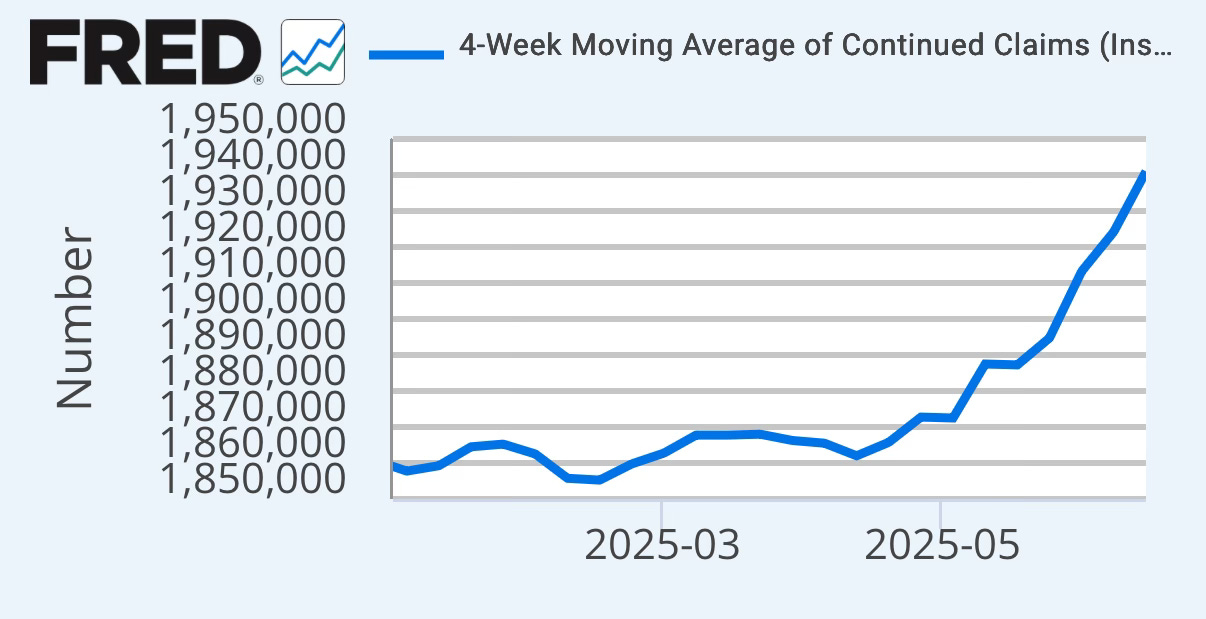
Simultaneously, unemployment data paints a bleak picture. Continuing jobless claims today rose to 1.97 million (up 8% YTD)—representing people laid off, unable to find work, and relying on government benefits to stay afloat.
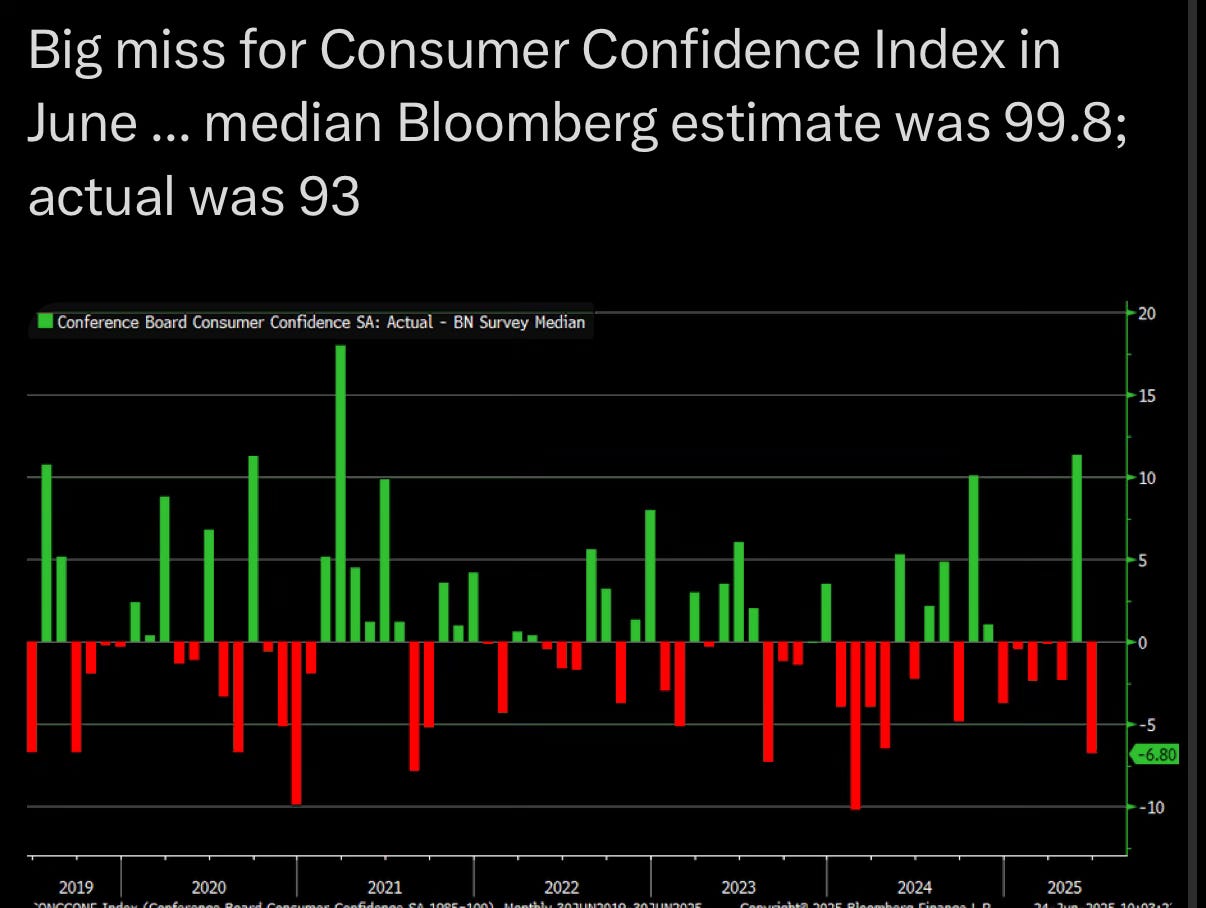
Another major concern is that the June Consumer Confidence Index was a BIG MISS!
The Bears are now dazed and confused. Very reminiscent of the scene in the movie The Big Short, where the bears were watching everything deteriorating, but their short positions were not increasing in value.
“It’s a rigged game. We bought into a rigged game.” — Charlie , The Big Short (2015)
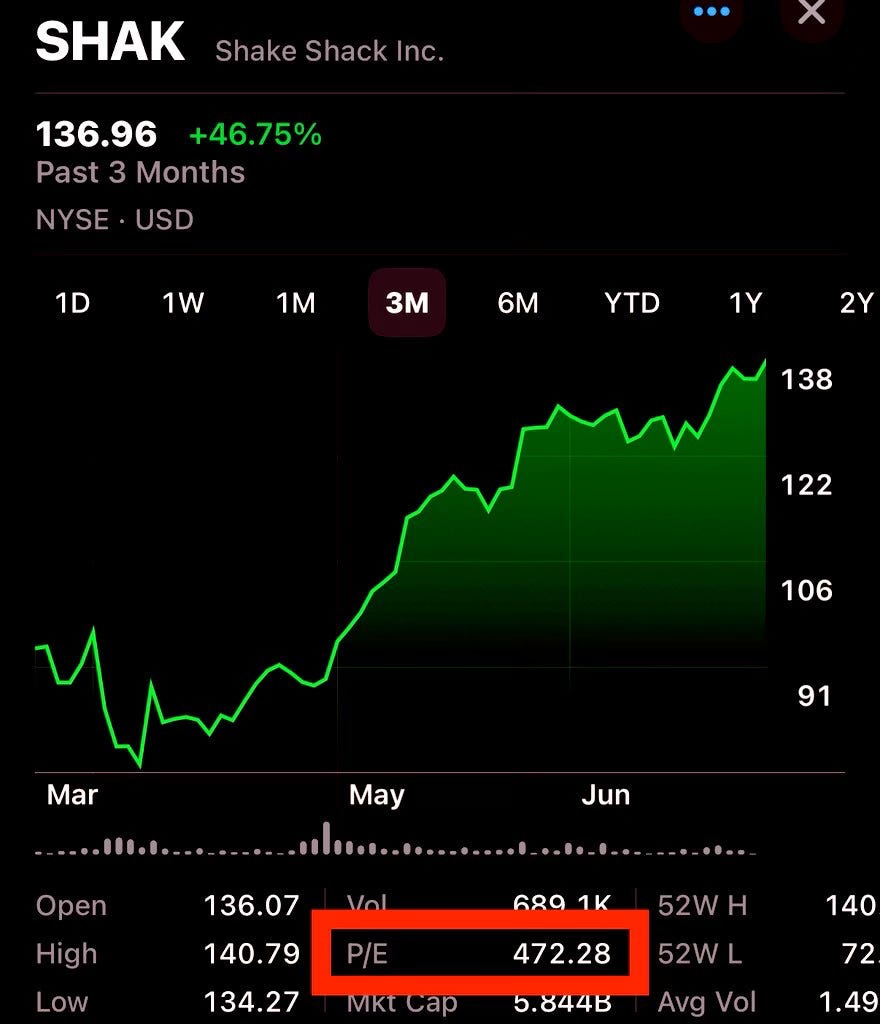
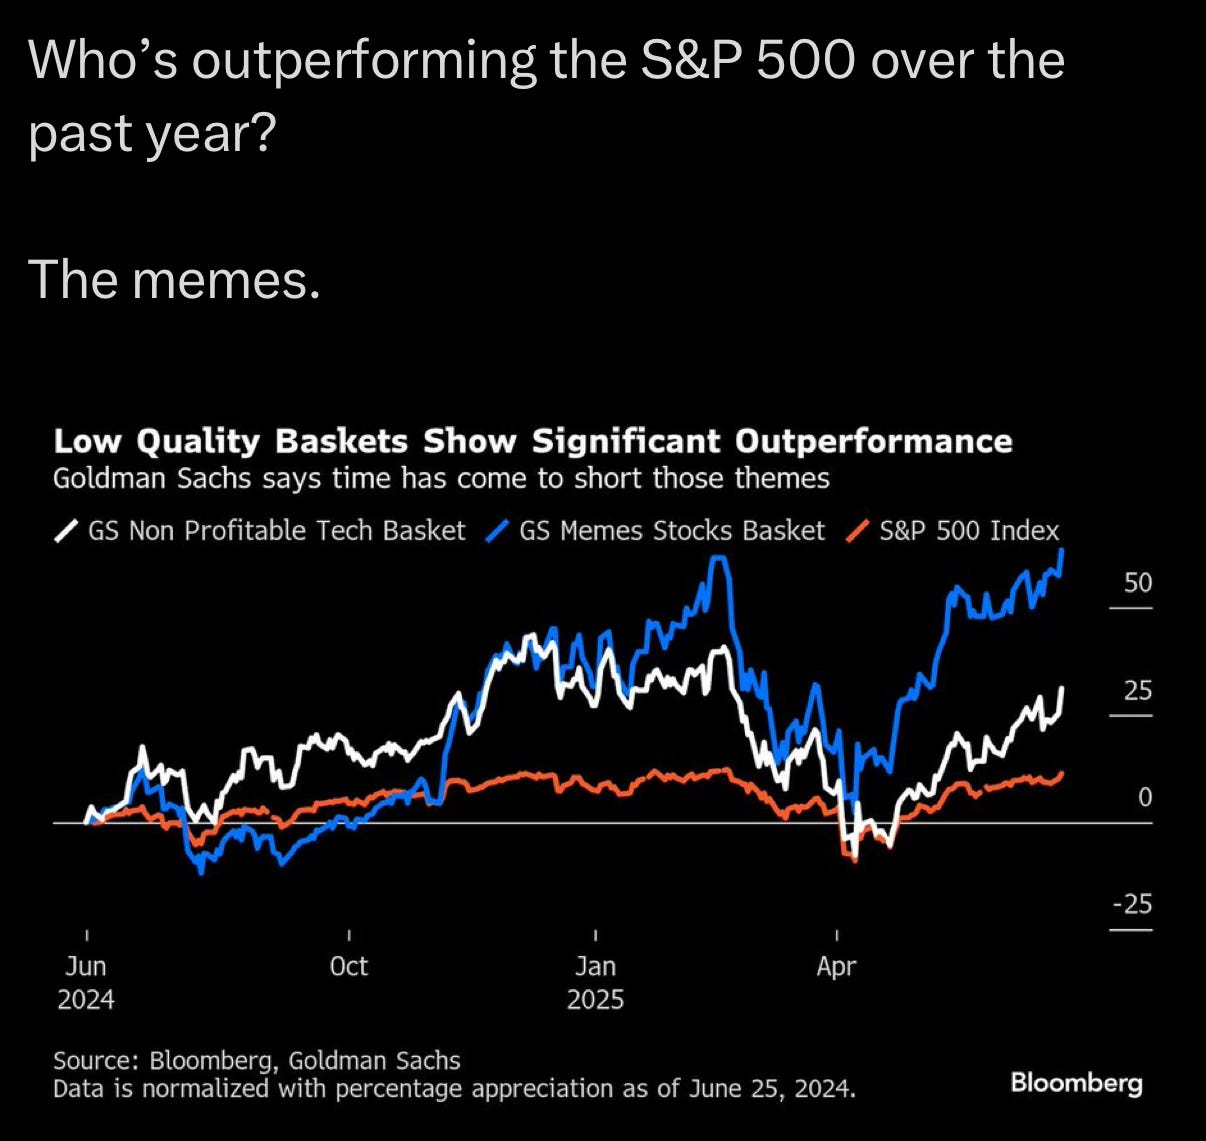
Beneath the surface of this market rally lies undeniable madness—textbook signs of a speculative bubble accelerating at full speed. The gains aren’t being driven by strong fundamentals or real earnings growth, but by euphoric bets on hype-fueled “meme” stocks with little to no profitability via call options ( as written here ). Shake Shack, a fast-food burger chain, is now trading at an eye-watering P/E ratio of 472—meaning investors are paying $472 for every $1 of earnings, a valuation more befitting a breakthrough company that discovers a cure for cancer than a business flipping burgers selling $1 sodas.
CrowdStrike has surged 45% year-to-date despite NEGATIVE earnings of -$0.69 per share, and therefore has no price-to-earnings ratio at all. Meanwhile, CoreWeave, which only went public in April, is up over 300% despite reporting a staggering loss of -$2.54 per share—again, with NO P/E ratio because there are NO profits to speak of. When unprofitable companies triple in value and burger joints command valuations more absurd than dot-com stocks ever did, it’s not a market climbing on strength—it’s a bubble built on delusion.
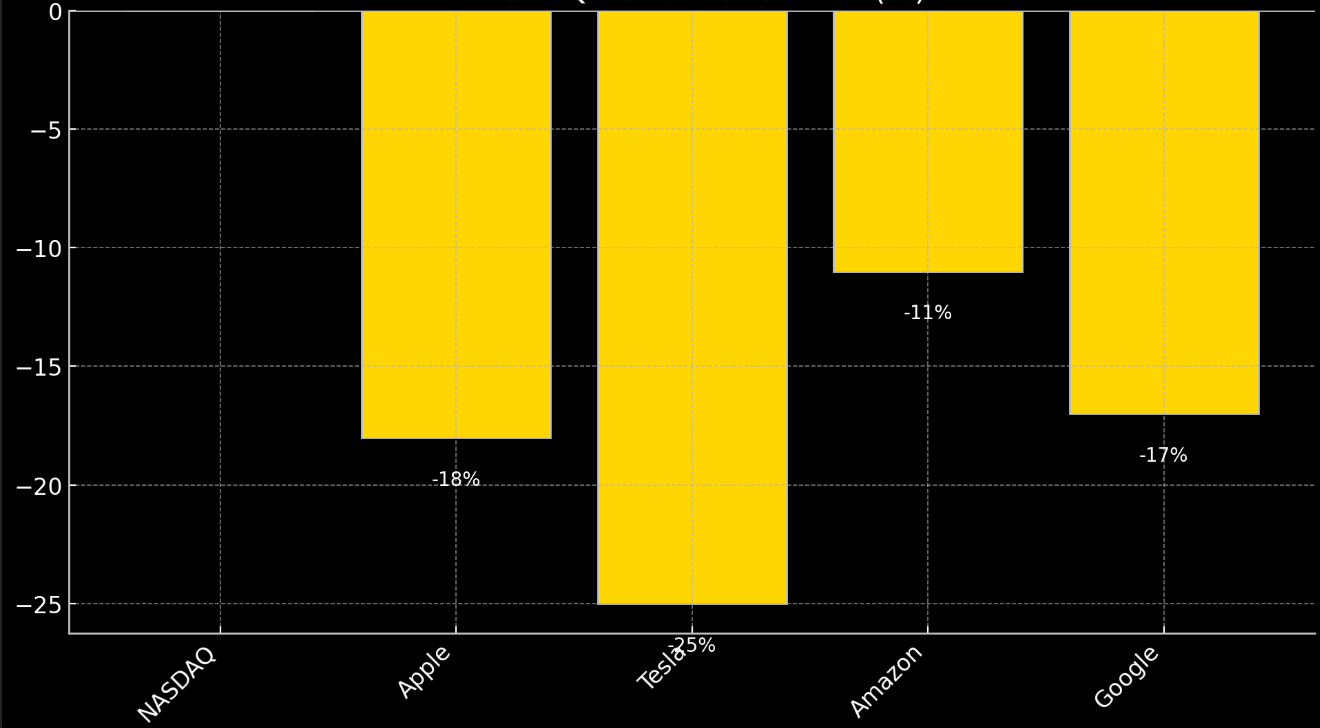
Market blue chips like Apple are still languishing—down about -20% since the tariffs were first announced along with Tesla is nearly down -25%, Amazon down -11%, and Google -17%.
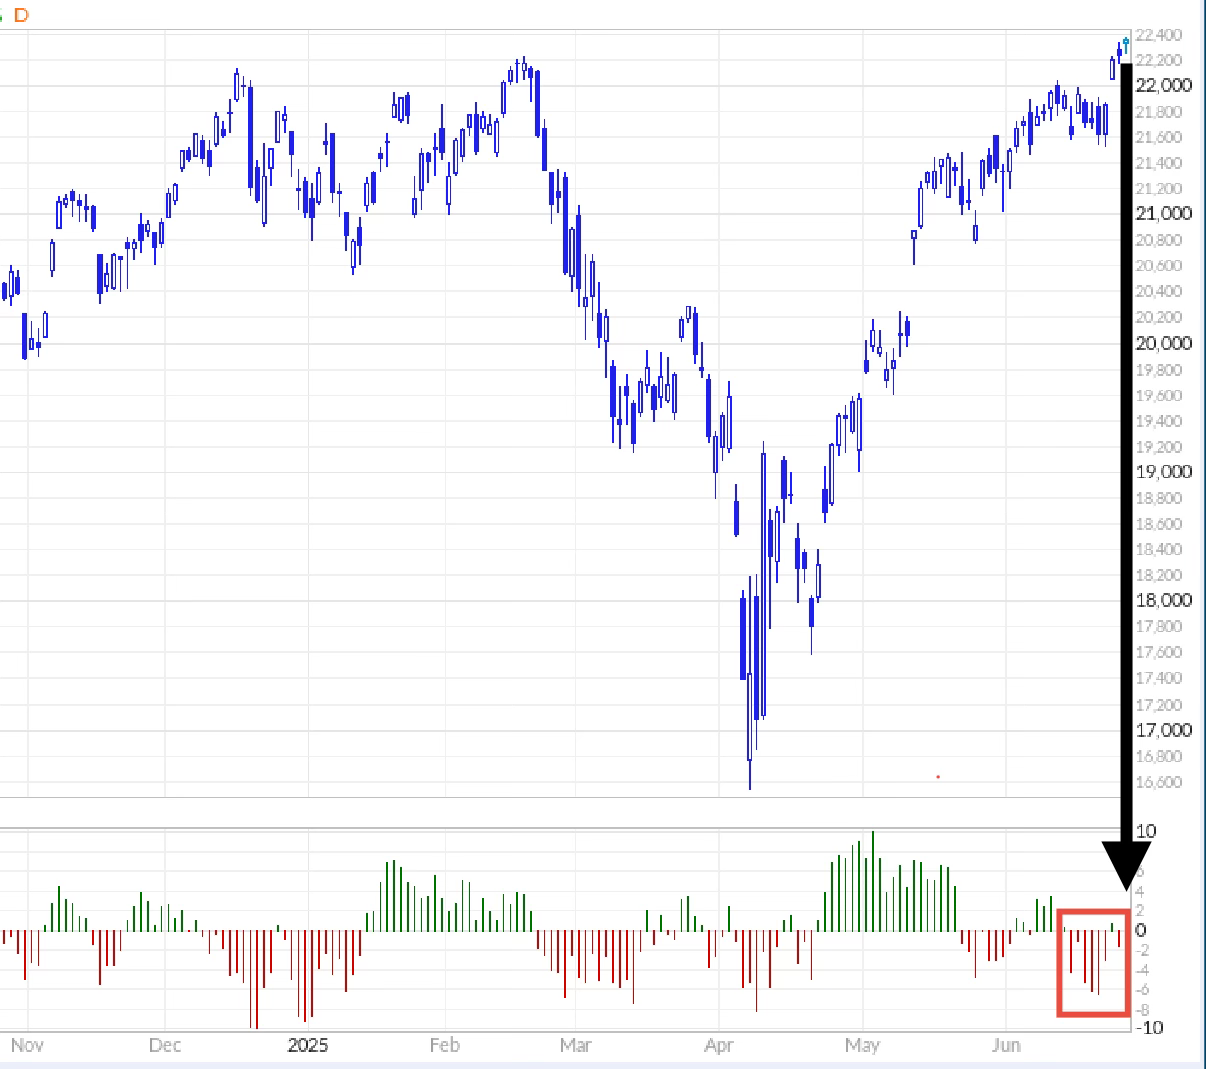
Market breadth indicators, notably the NASDAQ Oscillator (as noted in the chart below), a measure of market breadth indicating how many stocks are actively participating in a rally, highlighting the importance of broad market participation, highlighting the precarious nature of the current highs. Historically, this divergence is often a precursor to significant corrections.
Yet despite this cascade of negative indicators, the stock market continues to climb. Why?
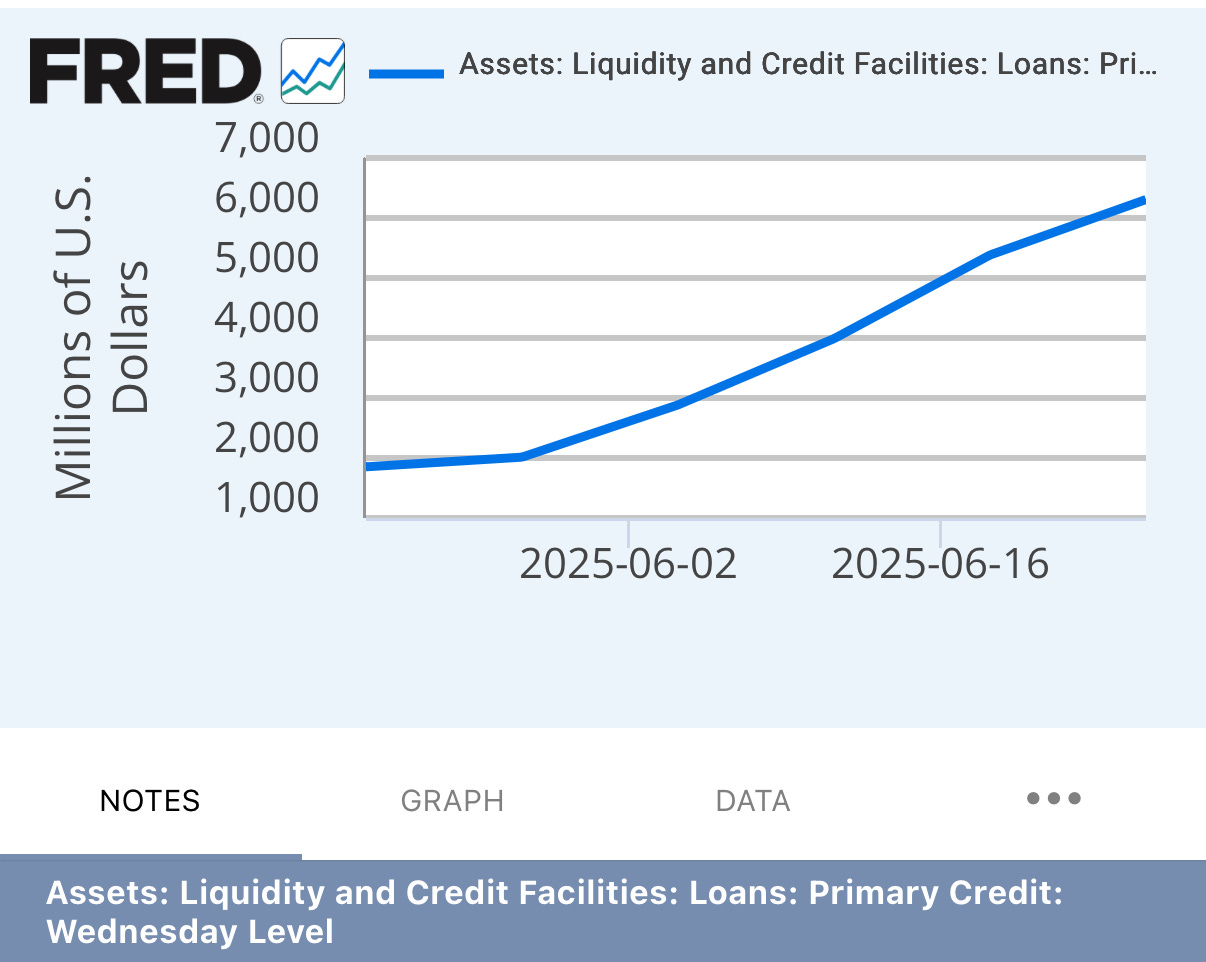
Fed Liquidity Returns Discount Window SURGES 320% in June!
🔒 [You’ve reached the halfway point. To continue reading our latest Fed liquidity analysis & strategies to protect your portfolio—upgrade to full access below.]
Keep reading with a 7-day free trial
Subscribe to The Coastal Journal to keep reading this post and get 7 days of free access to the full post archives.