Introduction
Today, we embark on a deep dive into the concept of stock market bubbles by comparing the infamous 1929 crash with the present-day scenario of 2024. In the summer of 1929, the stock market stood at an extraordinary pinnacle hitting its record high in the last week of August 1929, a beacon of prosperity and optimism. Little did investors know, this apparent zenith was the harbinger of a catastrophic collapse that would plunge the world into the Great Depression. As we navigate the complexities of the 2024 financial landscape, it is both chilling and instructive to explore the echoes of 1929 in today’s market. This examination reveals not only how history might be repeating itself but also offers crucial lessons for managing the current economic storm.. This analysis not only reveals how such bubbles emerge but also offers insights into their implications for the economy. We will employ various economic theories and data to understand why these bubbles form and what they signal about financial markets. By examining historical patterns and current conditions, we aim to uncover valuable lessons for navigating today’s economic landscape.
(Here is a Clip from a Stock Broker about August 1929)
The 1929 Stock Market and Economic Conditions
To begin, let’s scrutinize the economic environment and stock market conditions leading up to the 1929 crash. The Stockmarket peaked at the last week of August and first week of September of 1929, depending on the index. A fundamental metric everyone uses to analyze is the Price-to-Earnings (P/E) ratio. This ratio, which indicates how much investors are willing to pay for each dollar of a company’s earnings, was relatively modest throughout the early 1920s, ranging between 10 and 15. This range reflected a stable and reasonably valued market. However, as the decade progressed, speculation increased dramatically, causing the P/E ratio to soar to between 27 and 32 by 1929. Such a surge in the P/E ratio signaled that stock prices had become excessively inflated compared to the actual earnings, a classic indicator of overvaluation.
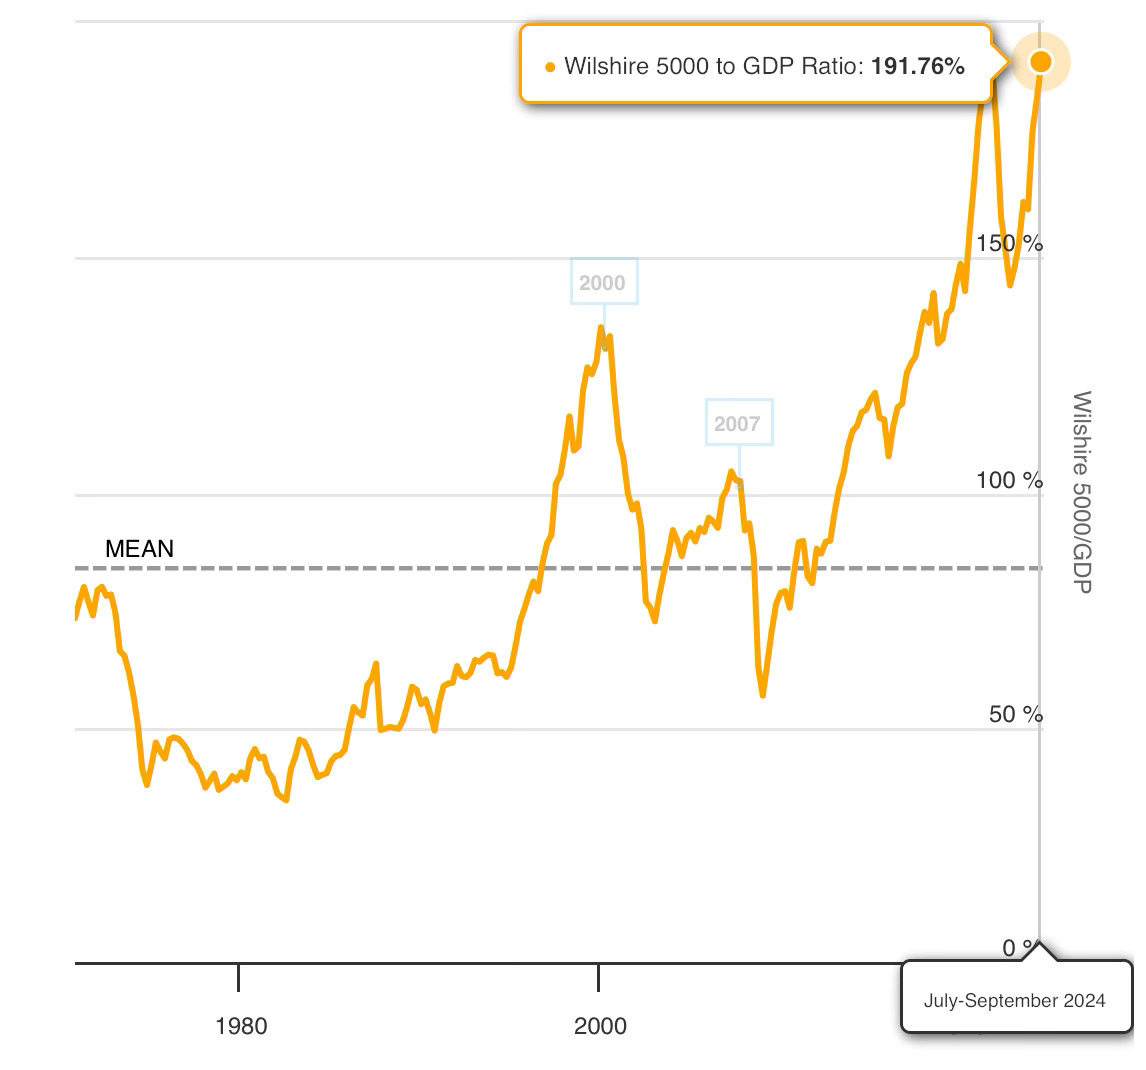
Equally telling is the market capitalization to GDP ratio. This ratio compares the total market value of all publicly traded companies to the Gross Domestic Product (GDP) of the economy. By 1929, this ratio had climbed to approximately 80 to 90 percent, signaling that the stock market was grossly overvalued relative to the overall economic output. This high ratio indicated that the stock market was driven more by speculative fervor than by solid economic growth.
Digging deeper into the economic weaknesses of 1929, we find several critical issues. Rising unemployment rates were a significant concern, as the economy failed to generate sufficient new jobs, leading to increased economic hardship. Industrial production, a key indicator of economic activity, was also on the decline, reflecting broader economic difficulties. High levels of consumer debt further strained the economy, reducing disposable income and curtailing consumer spending.
Additionally, the agricultural sector faced its own challenges with overproduction and falling crop prices, compounding economic woes.In 1929, as 22% of the U.S. labor force toiled in agriculture, the sector was already crumbling beneath the weight of its own success. The boom of World War I had driven farmers to ramp up production, but as global demand plummeted in the post-war years, a devastating oversupply emerged. Wheat prices nosedived from $2.94 per bushel in 1920 to a mere $1.00 by 1929, while corn prices plunged from $1.52 to $0.67 per bushel. This collapse in prices left farmers drowning in debt—$9 billion in total farm mortgages—unable to repay what they had borrowed during more prosperous times. The result was a tidal wave of foreclosures that swept away 600,000 farms, about 11% of all farms in the country. Sharecroppers and tenant farmers, particularly in the South, found themselves trapped in relentless cycles of debt, their livelihoods slipping away. Compounding the misery, the Smoot-Hawley Tariff and the declining global demand for U.S. agricultural exports further choked the sector. As rural poverty spread like a wildfire, bank failures surged, with 744 banks collapsing in 1929 alone, predominantly in farming regions. The exodus from these distressed lands intensified, as countless farmers fled to cities, seeking jobs that were becoming scarcer by the day—an omen of the Great Depression’s shadow looming over the nation.
The Federal Reserve’s monetary policies of the time played a crucial role in exacerbating these issues. In 1927, the Fed had lowered interest rates to stimulate economic growth, which inadvertently fueled speculative investments. By late 1928 and early 1929, the Fed began raising rates to temper the speculative frenzy, but these measures only led to tighter credit conditions and further economic slowdown.
Data:
• Interest Rates: The Federal Reserve adjusted interest rates in response to economic conditions:
• 1927: Lowered rates to stimulate growth, but this also encouraged speculative investments.
• 1928-1929: Increased rates to control speculation, but this led to tighter credit conditions and economic slowdowns.
Everyone On Leverage
(Here is a clip about how everyone in America was in the Stockmarket including the shoeshine boy)
In the years leading up to the 1929 stock market crash, the U.S. economy was marked by a significant increase in margin debt, which played a critical role in the speculative bubble that ultimately led to the Great Depression. Margin debt refers to the money borrowed by investors from brokers to purchase stocks, allowing them to buy more than they could afford with cash alone. This practice, while profitable during a rising market, greatly amplified the risks when the market turned.
Throughout the 1920s, the stock market experienced a dramatic surge in value, with the Dow Jones Industrial Average more than doubling between 1926 and 1929. Many investors, eager to capitalize on these gains, borrowed heavily to invest in stocks, often putting down as little as 10% of the purchase price in cash and borrowing the remaining 90% on margin. By 1929, the amount of margin debt had ballooned to unprecedented levels, as millions of Americans—from small-time investors to large institutions—became increasingly involved in speculative stock trading.
The widespread use of margin debt created a highly leveraged market, where even a small decline in stock prices could trigger massive selling as investors were forced to meet margin calls—demands by brokers for additional cash or securities to cover potential losses. When the stock market began to falter in October 1929, these margin calls became widespread, leading to a cascade of forced selling. As more investors rushed to sell their holdings to cover their debts, the market plummeted, exacerbating the crash.
The increase in margin debt was a key factor in the speculative frenzy of the 1920s and played a central role in the severity of the 1929 stock market crash. The reliance on borrowed money to fuel stock purchases created a fragile financial system, where the collapse of stock prices led to widespread financial ruin for investors and contributed to the onset of the Great Depression.
The 2024 Stock Market and Economic Conditions
Turning to the present-day scenario in 2024 the Dow jones has hit a record high on August 26, 2024 (like in 1929) and the SP500 is within 1% of a record high on August 26, 2024 and ironically the Nasdaq which has many of the AI bubble stocks is actually down -5% on August 26, 2024 from its all time record set on July 09,2024, we observe a series of parallels to the 1929 environment. The P/E ratios for the S&P 500 are currently around 28.39 (trailing) and 24.27 (forward). These figures suggest a market valuation that is significantly higher than historical norms, indicative of overvaluation similar to that observed in 1929.
The elevated P/E ratios imply that investors are paying a premium for stocks relative to current earnings, driven largely by speculative behavior based on AI, which has yet to produce any actual economic growth.
The market capitalization to GDP ratio in 2024 presents an even starker picture. At approximately 200 percent, this ratio far exceeds historical averages and suggests extreme market overvaluation. This high ratio indicates that the stock market is vastly inflated compared to the overall economic output, driven more by speculation than by underlying economic fundamentals.
Examining current economic indicators reveals troubling signs. Rising unemployment rates and an increase in continuing claims—currently around 1.8 million—reflect ongoing economic distress. Many companies are experiencing significant revenue declines and bankruptcies, echoing the economic struggles of the late 1920s.
Farm Economy and More
The U.S. agricultural sector is facing severe financial distress in 2024, marked by a dramatic 25.5% projected drop in farm incomes, following a 16% decrease in 2023. This sharp decline is primarily driven by a significant fall in commodity prices, with corn prices plummeting from $7.38 per bushel in June 2022 to $4.51 in May 2024, and soybean prices dropping from $16.40 to $11.90 over the same period. This steep decline in prices, resulting from oversupply and weakened demand, reflects broader economic challenges and places immense pressure on farmers, reducing their revenue and profitability.
The downturn in the agricultural sector has also led to a notable decline in demand for agricultural equipment. John Deere has forecasted a 20% decrease in equipment demand, and the company has been forced to implement significant layoffs. Farmers are responding to these economic strains by postponing new equipment purchases, opting instead for repairs and continued use of older machinery. This cycle of economic strain and reduced spending on equipment mirrors the overproduction and falling prices that plagued the 1920s, highlighting the recurring challenges faced by the agricultural industry in adjusting to volatile market conditions.
In 2024, corporate bankruptcies had increased by over 50% compared to the previous year, according to data from the American Bankruptcy Institute. This surge represented the highest number of bankruptcies since the financial crisis of 2008. The sectors most affected included retail, energy, and technology, with many smaller firms also going under as they struggled to secure financing or attract investors.
The wave of bankruptcies in 2024 highlighted the fragility of the post-pandemic economic recovery and underscored the challenges that businesses face in an environment of tightening monetary policy, inflationary pressures, and slowing growth. As companies continued to navigate these headwinds, the landscape of American business underwent significant restructuring, with long-term implications for the economy as a whole.
High levels of consumer debt continue to limit spending, exacerbating economic challenges and drawing parallels to the consumer debt issues of the 1920s. In 2024, American consumers are drowning in a staggering $1.2 trillion of credit card debt, a burden that has ballooned alongside rising consumer delinquencies. This wave of financial distress has surged by over 13%, pushing delinquencies to their highest levels since the 2008 financial crisis. As millions struggle to keep up with their mounting debt, the cracks in the economic foundation are becoming impossible to ignore. This sharp increase in delinquencies signals a looming financial disaster, eerily reminiscent of the last major collapse, raising alarms about the stability of the broader economy.
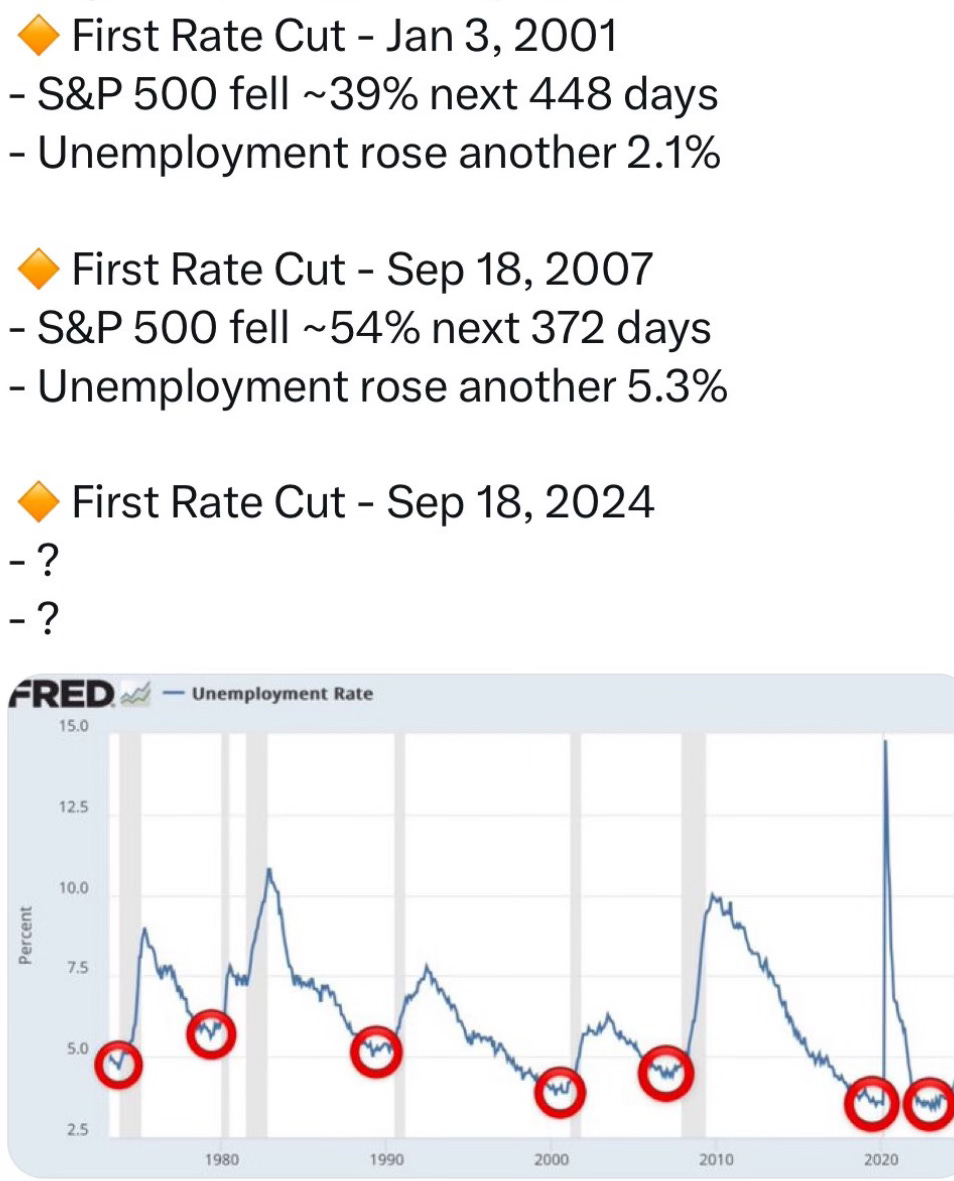
Federal Reserve policies in recent years have seen a pattern similar to those of the late 1920s. Initially, the Fed kept interest rates low to support economic growth, a strategy that contributed to speculative behaviors in the stock market. More recently, the Fed has undertaken aggressive rate hikes to combat inflation due to the US government increasing money supply by 35% while at the same time briefly limiting supply production of goods, introducing new risks and increasing market volatility. From 2022 to 2024 the Federal Reserve raised interest rates to 5.5% the highest level in 24 years.
Keep reading with a 7-day free trial
Subscribe to The Coastal Journal to keep reading this post and get 7 days of free access to the full post archives.


