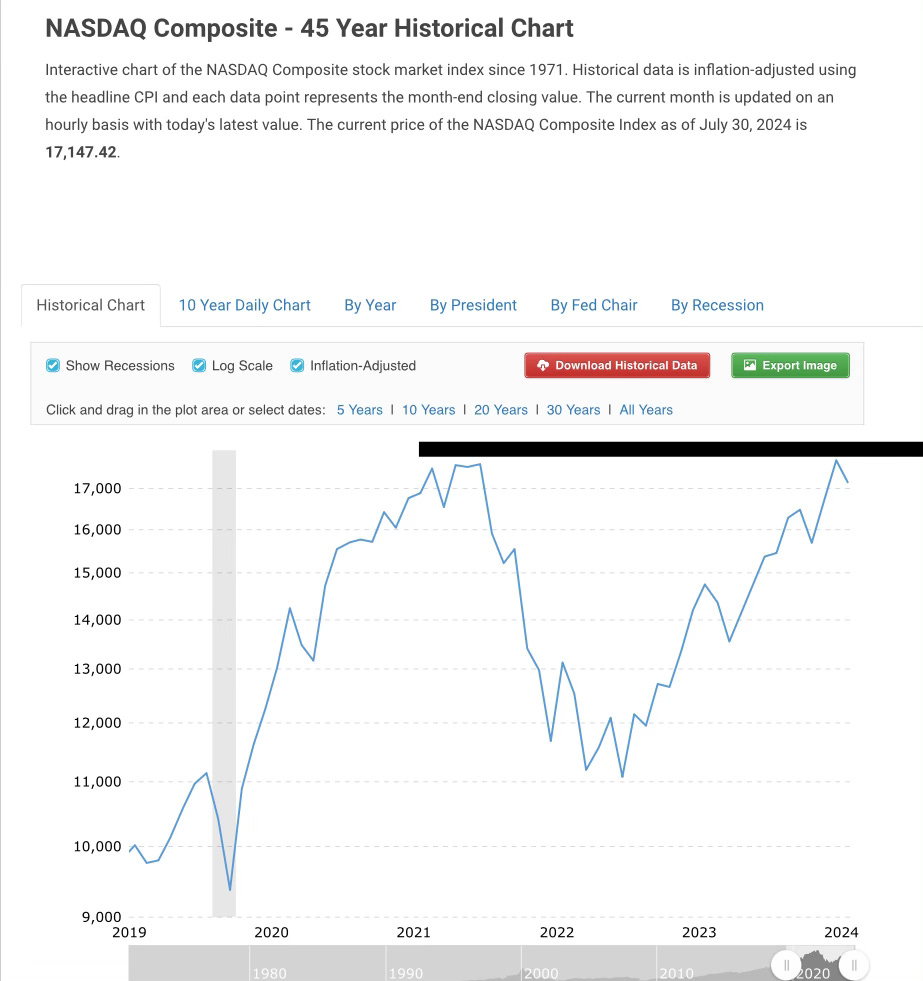
As Wall Street grapples with soaring volatility and an uncertain economic landscape, a chilling parallel to the inflationary bear markets of the 1970s, 1980s, and early 2000s is emerging. The Nasdaq, which peaked in January 2022, has already slipped into negative territory when adjusted for inflation, and further declines could lead to nominal losses as well.
An inflationary bear market occurs when rising prices erode purchasing power, leading to a decline in real investment returns even as nominal prices may remain stable or increase. During such periods, the cost of goods and services increases at a faster rate than investment returns, resulting in negative real returns for investors. Historical examples include the 1970s, when stagflation—high inflation combined with stagnant economic growth—led to prolonged bear markets. Similarly, the early 1980s and 2000s saw significant inflationary pressures that contributed to market downturns.
In the current environment, inflation has surged since 2021 to a total of 20% due to expansive fiscal and monetary policies. This inflationary pressure has put downward pressure on the Nasdaq, causing it to lose value in real terms since its peak in January 2022. If inflation continues to rise or remains elevated, further declines in real investment returns could push the index into nominal losses.
The current market dynamics underscore the risks associated with inflationary bear markets. Investors must navigate not only the volatility and potential for significant market declines but also the erosion of purchasing power that accompanies high inflation. This environment calls for strategic asset allocation and a focus on investments that can preserve value in real terms, such as gold, and bonds.
The Federal Reserve’s Role
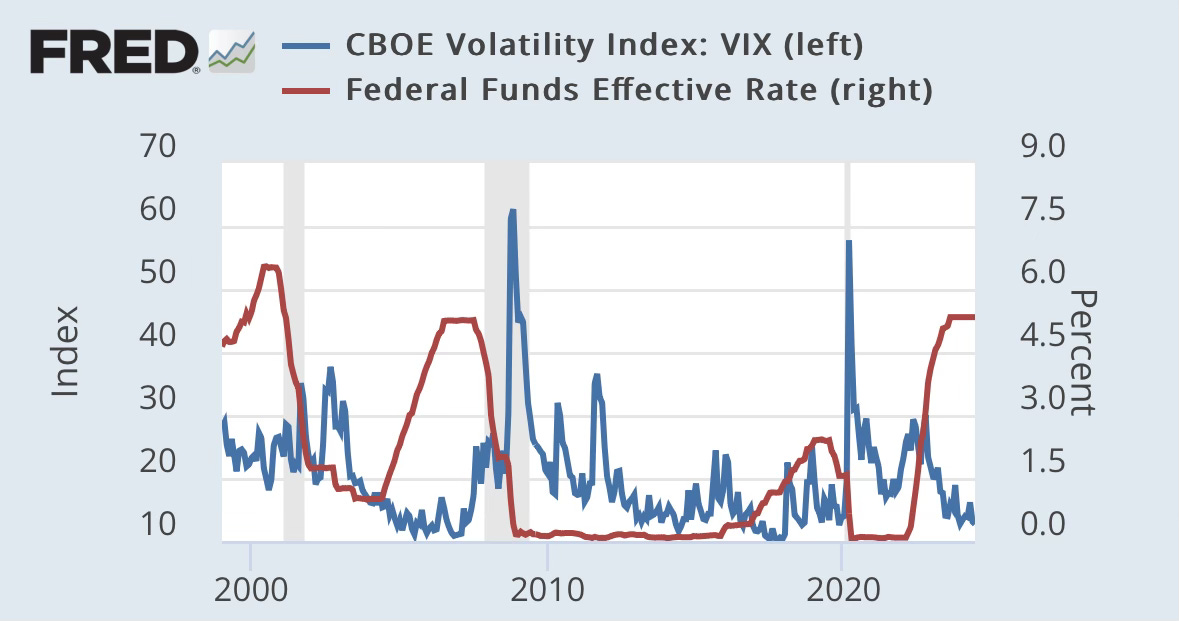
The Federal Reserve’s aggressive interest rate hikes to combat inflation have set the stage for a potentially prolonged period of market turbulence. As the central bank aims to bring inflation down to its 2% target, investors are bracing for a bumpy ride reminiscent of past inflationary bear markets. Higher interest rates are squeezing corporate profit margins, increasing borrowing costs, and reducing consumer spending power—all of which are bearish signals for the stock market. The chart below shows that over the last inflationary bear market, as the Federal Reserve lowered interest rates because the economy was weakening, the VIX went higher as investors fear a recession and weak economy, which ended up of being correct in 2001 and 2008.
VIX Surge: A Warning Signal
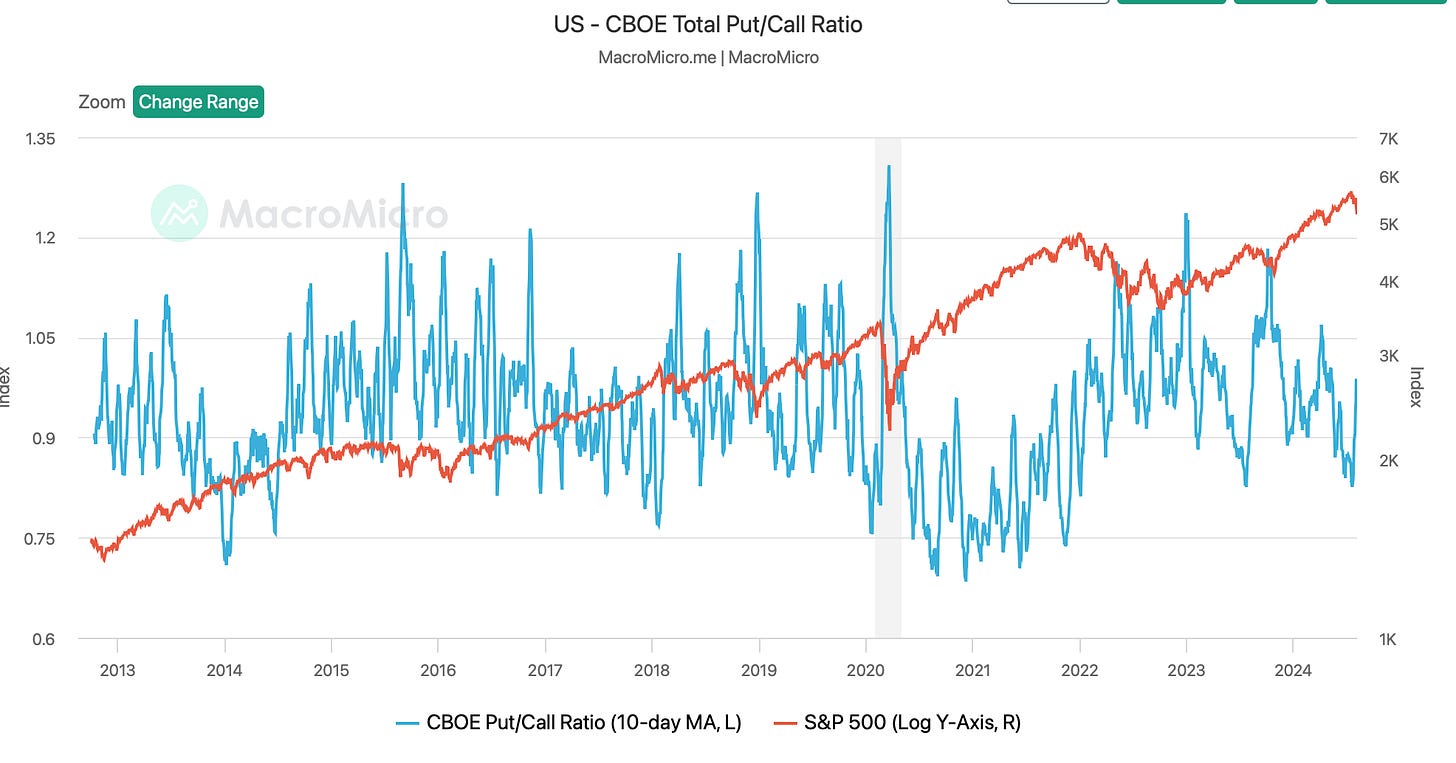
The CBOE Equity Put/Call Ratio is an important indicator used by investors to gauge market sentiment which is at .81 today. A ratio of 0.81 means there are 0.81 puts traded for every call option, reflecting a tendency towards bullish sentiment among investors. This ratio is currently unchanged from the previous market day but has increased by 30.65% from 0.62 one year ago.
To put the current ratio of 0.81 in perspective, it is significantly lower than levels observed during periods of major market sell-offs. For instance, in 2020, when the S&P 500 fell by approximately 30% in a single month due to the COVID-19 pandemic, the put/call ratio was around 1.2. Similarly, in 2022, during another period of significant market decline, when the stock market was down about -30% from its highs, the ratio was also around 1.2.
This skew towards call options suggests that investors are generally still optimistic about future market prices higher. However, such optimism can create vulnerabilities. When market sentiment is heavily biased towards calls, even a minor decline in the market can trigger a significant increase in volatility. This is because the prevailing bullish positions may quickly unwind, leading to a rush to hedge or sell positions.
The VIX, or Volatility Index, measures market expectations of near-term volatility conveyed by S&P 500 stock index option prices. Historically, the VIX rises when the market declines as investors rush to buy puts for protection. In a scenario where a minor market drop happens, the demand for puts increases, pushing the VIX higher.
The concern intensifies when considering the possibility of a larger market sell-off, such as a -20% decline. In such a case, the VIX could potentially surge above 100 this year says Chief Economist Greg Crennan. He goes on. and says “This level of volatility hasn’t been seen since the 2008 financial crisis, indicating extreme market fear and uncertainty. During such events, the rapid unwinding of bullish positions can lead to a cascade of selling, further exacerbating market declines and volatility.”
In summary, while the current put/call ratio reflects a bullish market sentiment, it also sets the stage for heightened volatility going forward. Investors should be aware of the potential for rapid changes in market dynamics and prepare for the possibility of significant market movements that can lead to a dramatic increase in volatility.
For more articles on the options market check out the following if you haven’t already
Historical Parallels: Lessons from the Past
The current market dynamics are eerily reminiscent of past inflationary bear markets. In the 1970s, the oil crisis led to rampant inflation, which, coupled with rising interest rates, created a brutal bear market That investors didn’t know they were in till after the fact.
Keep reading with a 7-day free trial
Subscribe to The Coastal Journal to keep reading this post and get 7 days of free access to the full post archives.


